After more than 8 years working with NestJS, I have to say it: this new Observability feature has genuinely surprised me.
Not because observability is something new. We've been working with logs, metrics, traces, APMs, external dashboards for years. That exists. But what really caught my attention is how NestJS is doing it: completely integrated into the framework, not as an external add-on.
🔍 It's Not New, It's Integration
Observability isn't a recent invention. We've been working with:
- 🔹 Distributed logs
- 🔹 Performance metrics
- 🔹 Distributed tracing
- 🔹 APMs like Datadog, New Relic, or similar
- 🔹 Custom dashboards
All of that works. All of that exists.
But here's the differentiator: NestJS isn't trying to be just another APM. It's making observability native to how you develop.
The difference between "having an APM" and "having the framework understand observability" is massive.
When you add observability from the outside, there's always a mismatch. It's like trying to fit a square into a circle. Tools don't understand your application's architecture because they're not part of it.
🏗️ Speaking the Same Language
One of NestJS's biggest strengths has always been that things are well-structured and intuitive. Modules, services, decorators, pipes, middleware—everything makes sense as an architect.
And that's exactly the philosophy they've followed here.
👉 NestJS observability isn't a foreign plugin. It's a natural part of how you build the application.
Think about it: when you define a service in NestJS, you're automatically in an observable context. You don't need strange additional configuration. You don't need to import observability libraries everywhere.
const app = await NestFactory.create(AppModule, {
  instrument: ObserveInstrument,
});
That's it. You're automatically instrumenting your entire application.
This is different from having to:
- ✅ Add decorators manually
- ✅ Wrap functions in instrumentation
- ✅ Configure exporters separately
- ✅ Map APM structures to your code
📊 The Dashboard That Matters
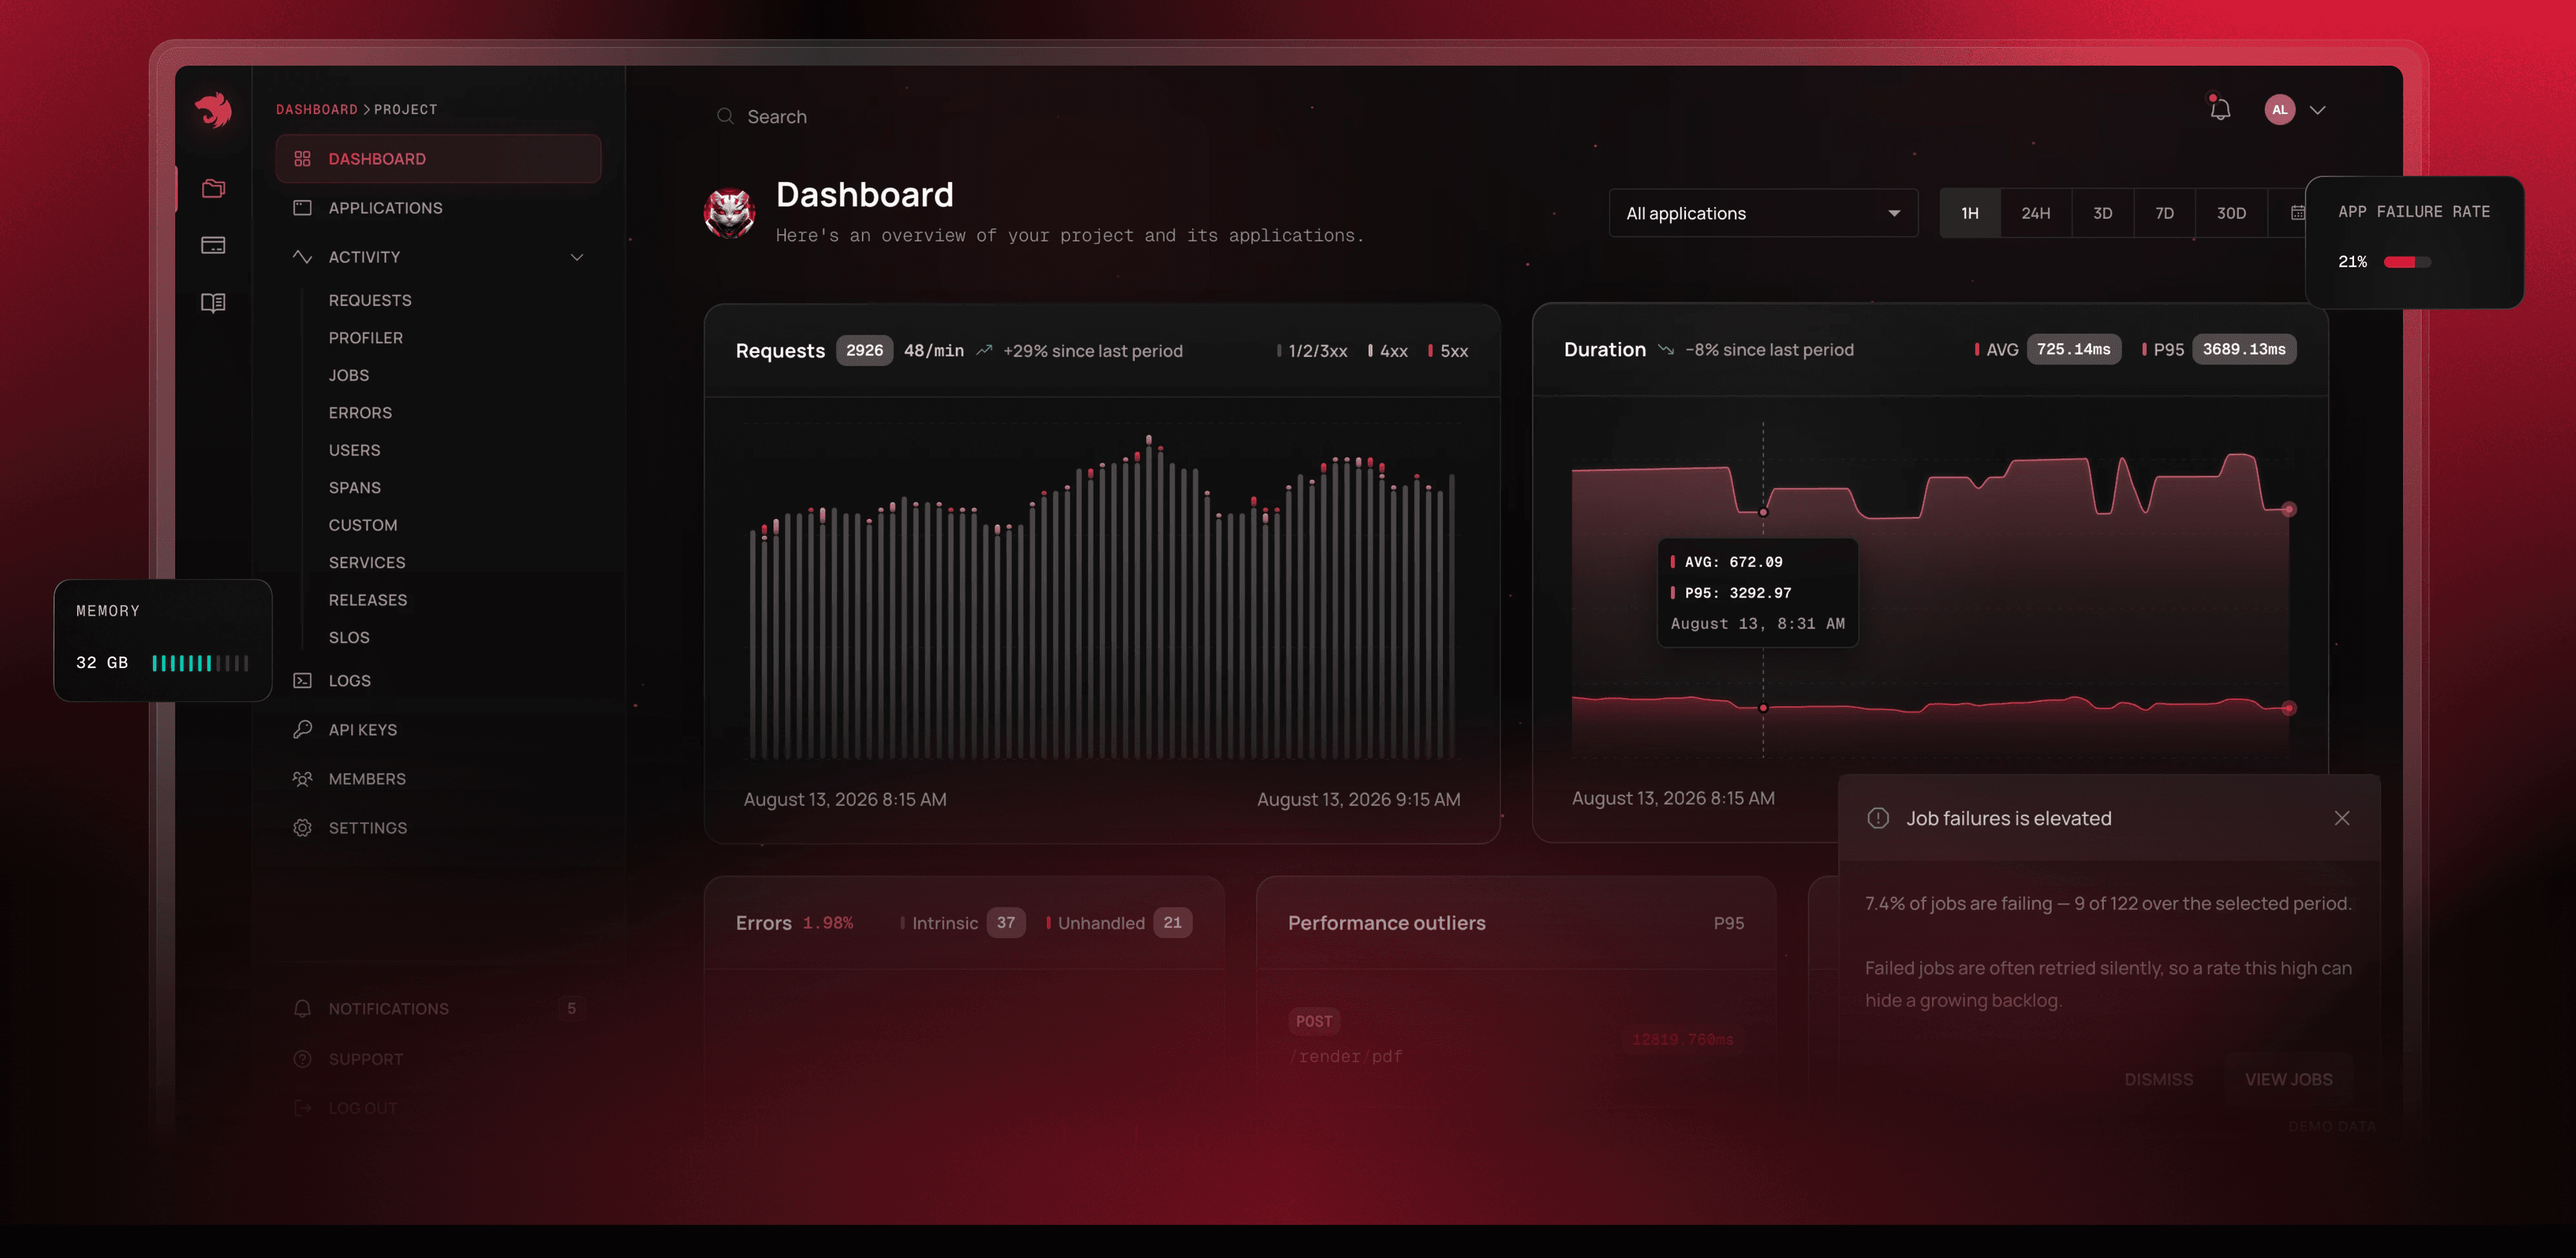
The dashboard is especially interesting because it's clean, simple, and easy to understand.
But the important part isn't that it's pretty. It's that it shows you what really matters in the context of your NestJS application.
You can see:
- 🔹 Requests: overview of which endpoints are being called
- 🔹 Services: breakdown by service, not by port or machine
- 🔹 Errors: errors grouped in a way that makes sense
- 🔹 Jobs: if you use queues, they're here
- 🔹 Spans and Traces: granular breakdown
- 🔹 Logs: contextualized
- 🔹 Releases and Runtime metrics: complete visibility
But here's the important twist:
You're not just seeing: POST /orders → 2.4s
You can drill down and see exactly which part of your application is consuming that time.
For example: OrdersService.recalculate() is taking 1.8s
And from there, follow the trace, review the spans, see the logs, understand exactly what happened during that execution. Was it a database query? A call to an external service? A heavy calculation?
The difference is huge: you go from "my application is slow" to "OrdersService.recalculate() is doing 5 N+1 queries because I'm not loading relationships correctly."
That's real visibility. That's what matters in production.
🎯 Architecture Alignment
This is where I think the real value lies.
NestJS isn't simply adding another APM to its ecosystem. It's making observability speak exactly the same language as your architecture.
Think about it:
- Your application is structured in Modules and Services
- The dashboard shows you performance by Modules and Services
- Traces are organized according to your code's call path
- Errors are contextualized within your architecture
No translation. No weird mapping. No "I'd have to cross three different tools to understand what happened."
It's all coherent.
👉 This is what changes the experience of working with observability in production.
🚀 Low Entry Barrier
There's another thing I especially like: the entry barrier is very low.
Integration is surprisingly simple. You don't need:
- ⚠️ To learn a new complex tool
- ⚠️ To configure exporters, collectors, or separate agents
- ⚠️ To map your code to foreign concepts
- ⚠️ To maintain additional infrastructure
Just: instrument: ObserveInstrument
And you already have visibility.
Obviously, this doesn't replace:
- ✅ Good architecture from the start
- ✅ Well-thought-out and structured logging
- ✅ Business metrics
- ✅ Well-configured alerts
- ✅ A complete observability strategy
But it drastically reduces the work needed to start having real visibility into what's happening inside a NestJS application.
And that matters. Especially when you've been in production for years and need to quickly understand where the problem is.
💭 The Real Change
After so many years building backends with NestJS, I believe this is one of those features that can really change the experience of working with applications in production.
It's not just having more data.
It's being able to understand it in a much more natural way, within the context of how you actually built the application.
Most observability tools are agnostic. They work for monitoring anything: APIs, databases, random services, virtual machines.
But that means they never fit perfectly with your specific code.
This is different here.
Here observability is designed for NestJS and by whoever built NestJS. It understands Modules, Services, decorators, the lifecycle of a request, everything.
And honestly, it can still grow and improve. But as a starting point, as a way to change the relationship between developers and observability in the NestJS ecosystem, I think it's pretty solid.
If you work with NestJS in production, it's worth exploring. Not as a replacement for your current stack, but definitely as a tool that can save you hours of debugging and frustration.